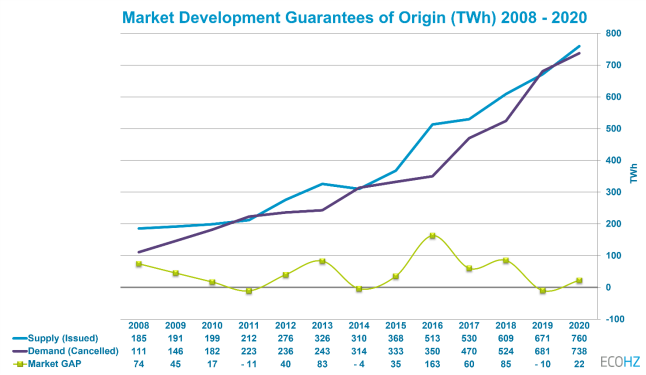
“Renewable energy demand has grown by an impressive 8% from 2019 to 2020, during a year where energy consumption and industry output have slumped across most of Europe,” says Tom Lindberg, Managing Director at ECOHZ – commenting on new statistics from the Association of Issuing Bodies (AIB). Lindberg suggests that a paradigm shift can be in the making, with reductions in the year-over-year surplus of renewable energy a likely reality.

Demand growth continues
Despite alarming predictions, the market demand for renewables has continued to grow at a steady pace during 2020. The impact of lower industrial activity as a result of COVID-19 has been limited, and the European thirst for renewables seems unstoppable. This is reflected directly in the annual market figures of Guarantees of Origin (GO), produced by the Association of Issuing Bodies (AIB).
The overall tendency in the GO market is a robust and growing market demand, coupled with a somewhat stable supply situation. The market demand has grown by an impressive 8% from 2019 to 2020. This during a year when energy consumption and industry output has slumped across most of Europe. Annual growth (CAGR) from 2008 to 2020 is a solid 17%.
Forces behind the growth
“The corporate sector’s need for more renewable power is still the main thrust behind the continued increase in demand. But national energy policy change is also making a positive impact. Specifically, the implementation of full disclosure (various models) in countries like the Netherlands, Switzerland and Austria has contributed significantly. Especially in the Netherlands, with its “best practice” implementation of Full Consumption Disclosure, impacts the market in a positive fashion,” says Lindberg.
It is worth noting that the Netherlands with a growing demand reaching 54.4 TWh in 2020, is only able to cover around 50% of the demand from locally originated production. It is in need of importing the rest from other European renewable sources.

Pent up surplus decreases – expiry numbers falling
Although 2020 still shows a slight aggregate surplus of GOs in the market, the trend is clearly that the market is moving toward a better balance between supply and demand. This is also supported by the falling number of GO’s expiring (after 12-month validity) – three years in a row. As the market slowly moves from an annual market to monthly and daily, we may expect expired volumes to grow again. This increased market complexity and shorter matching periods may result in less buyers being matched with correct supply.
The relative share of expired GOs compared to Issued certificates during the same periods has shrunk from 8.3%, to 5.2% to 3.4% in 2020. “This is a very clear indication that the historical surplus in the market is about to disappear,” states Lindberg.
Some other observations
- The AIB now includes most European countries with significant volumes of renewables – having included markets like Portugal, Serbia, and Slovakia in 2020. The number of countries still outside the AIB and aspiring to join in the next few years is limited. Their aggregate production, and thus potential new renewable supply (GO issuing) is comparably low as well.
- Technology-wise, the main trend is that the growth in wind continues to outpace all other technologies related to issuing. Hydro is still the largest single source of renewable supply, providing more than twice the volume than wind.
- Norway seemingly has a sharp increase in demand the last 2-3 years, but most of this increase is related to exports of GOs to the UK market, through the Norwegian registry. When Norway’s figures are corrected for this export, Norway has a flat demand development of around 26 TWh.
- Increasingly, we have seen that countries are issuing GOs from non-renewable (fossil and nuclear) sources, but we now also see significant demand for (cancellations) for non-RES GOs. This figure reached almost 90 TWh in 2020, primarily driven by the Netherlands, Austria, Switzerland, Spain and Sweden.
Outlook for 2021 – looking promising
“The outlook for 2021 is promising in terms of market robustness. Summarized, there are four key indicators that clearly can fuel the market toward an equilibrium, or even a situation with demand outpacing supply for periods of time,” says Lindberg.
- A likely economic and industrial rebound from the current “COVID-19 situation” will spur a sharp upturn in corporate demand for renewables.
- The hydrological situation in the Nordic region is likely to result in lower power production levels in 2021 than in 2019 and 2020. This may result in an overall drop in the supply of Nordic GOs, with as much as a 10-15 TWh reduction just from the Norwegian market.
- The move away from annual reporting schemes, towards monthly or even shorter reporting periods – coming from policy makers in a select number of countries, as well as influential corporate buyers – can change the market dynamics significantly.
- Future supply growth is likely to taper off, and will come from new renewable production, and related GO issuing, and less from growth in new AIB memberships. Few potential AIB members have renewable production of such a size that it can influence the aggregate demand significantly.
A “wild-card” in the described market scenario is Brexit. The UK will limit the import of European GOs in 2021, and the total volume is likely to drop from the 59 TWh imported in 2020. As with many issues related to Brexit, the final outcome is not clear yet, but it does mean that a certain surplus volume will need to be transacted in Europe, if not allowed access to UK buyers. Given that the surplus volume is limited to 30-40 TWh, it is realistic to expect this to be negated by higher overall demand growth in Europe.
Disclaimer
There is always a degree of uncertainty regarding accuracy and timeliness of reported national statistics to the AIB. Historically a few countries experience a time lag of some months for reporting correct statistics, although the problem seems to be somewhat smaller than earlier years. Although late reporting may change the final figures, the development will likely show a market moving towards a clearer equilibrium compared to any previous time.


 Copyright 2017-2023 All rights reserved.